Management Information Design Blocks
In any MI design, you need to set your KPIs and measure in defined nominal “categories”. For example, if you want to compare department and user response times in any system (not just AXLR8 RequestTracker) you need to name the departments and users who are responsible for the activities.
Let us start with the process measures that are essential for the other number matrix entries. You could use “Request Status” as the column headings and see how many requests were in each Information Request Status. However, most organisations have too many Information Request Statuses. Thus, in the graphs, Kanbans and the dashboards you need to define categories of status types.
Likewise there are dozens of different types of Information Request and other entities we track. Therefore, these can be categorsed into:
- DPA
- FOI
- EIR
- DataBreach
- Complaints
- etc.
Lastly, where you are measuring perfromance against deadlines, you need to have those dates in the system. Many IR “Due Dates” are automatically updated to align with regulatory requirements. These are defined in FAQs elsewhere. However, the sub-tasks you allocate to reps in the specialist service areas need an earlier due date. The reason for this is that, once their responses come back to you, you need a few days to collate, check, possibly ask for clarification, redact, package and send.
“You can only mange what you can measure”
Column Headings
Hopefully, the first column in the dashboards will be obvious: Perhaps department or user or type or request. You will be able to define these in Dropdowns Admin. Users can then pick them from menu options ensuring accuracy and standardisation of names. Running, Paused, Open and Closed are all defined and documented together with the effect they have on the statutory due dates for Informaton requests.
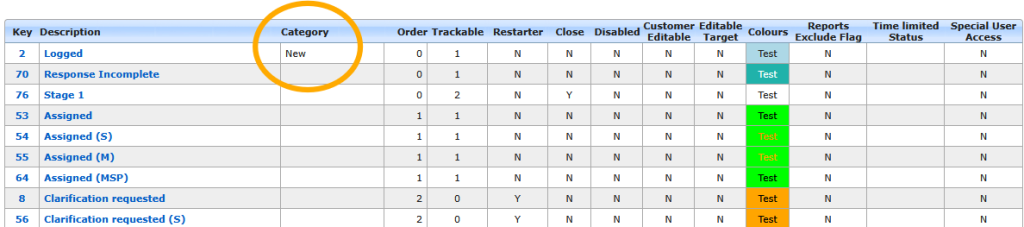
In many clients’ systems we need to define newly arrived status(es).
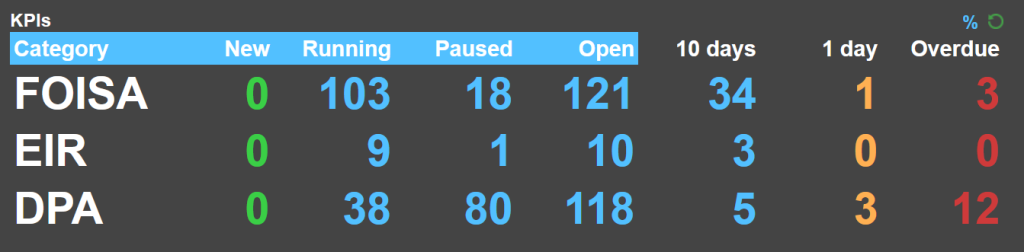
We need to create a heading called “New”. This is for incoming IRs as the name suggests. You can include any Request Status in this. In theexampel below, only “Logged” stats is marked as being in the “New” category of IR Status. In your system, this might be one or more of (e.g.) “Incoming”, “Triaged”, or “Received”
Category (Row) Headings
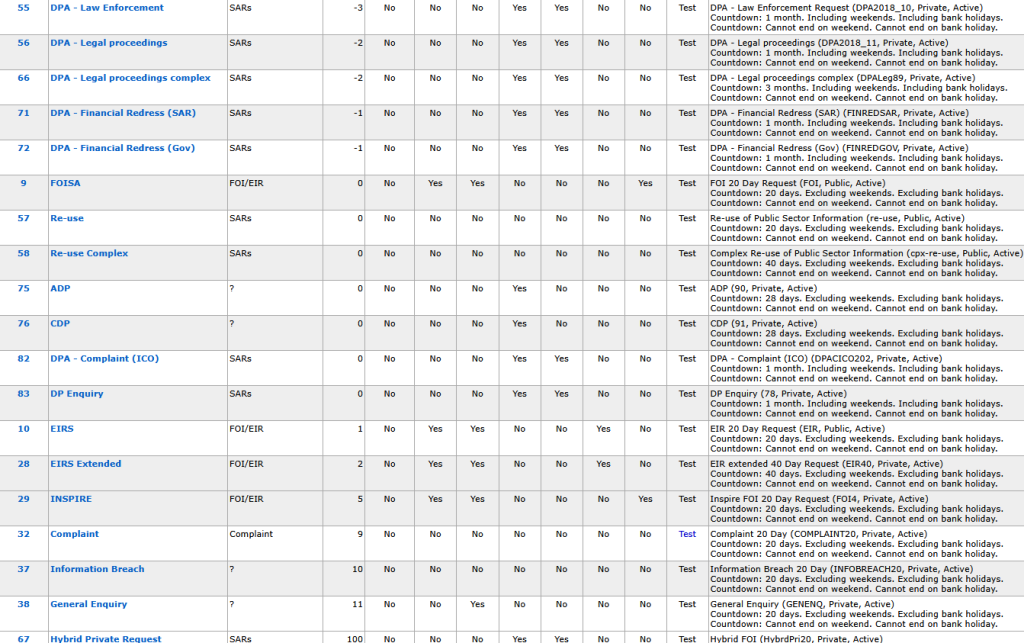
In the Team Performance Dashboard, there is a Categories first column doe Request Types. The example below shows that the authority (with dozens of RequestTypes) have categorised anything beginnig with “DPA” and a few others as “SARs”. Thus, all are represented in oe row in their dashboard.
The set up for this dashboard is also used in the Service Area Response League Table.
In the team Performance Dashboard there is a 9 or 10 char limit. Otherwise that roew heading wraps onto two lines. So, Germans may have to go kurtz on “Datenschutz”. The reason is that these widgets may end up as a quarter of a dashboard made of 4 widgets on a page. They need to scale. However, the important thing is to set up categories you find helpful for your KPIs.
If you need more information or help on these set up staps or wish to modify yours please call or email support@axlr8.com
.